


Build trading strategies without writing code.
PULSAR is one workspace for the whole loop — design a strategy in a visual builder, backtest it over years of market data, study it on professional charts, and deploy it to paper or live execution.
The platform
Everything the strategy workflow needs, in one place.
Most traders stitch together a builder, a backtester, a charting tool and a spreadsheet. Pulsar puts all four in a single workspace, so a strategy carries its rules, its history and its statistics wherever it goes.
Strategy Creator
Compose entries, exits, indicators, filters, position sizing and risk rules through a guided interface. Preview the logic before it ever runs.
Explore the builderBacktesting Engine
Replay a strategy across years of history with configurable capital, costs, slippage and execution assumptions — then inspect every trade it took.
Explore backtestingChart Analysis
Professional charting with drawing tools, indicator panes, strategy signal overlays and manual order entry directly from the chart.
Explore chartingAnalytics Workspace
Risk-adjusted ratios, PnL distributions, drawdown profiles and trade attribution — available on backtests, the portfolio and the analytics page alike.
Explore analyticsPortfolio & Live Trading
Track equity, open positions and strategy activity in real time. Pause, close or stop everything from one control surface.
Explore the portfolioNot sure where to start?
Walk the full feature overview, or ask us for a guided look at how Pulsar would fit the way you already trade.
Strategy Creator
Design a complete trading system in an afternoon.
Pick your instruments, stack your indicators, define what a signal means, and set the risk envelope. Every field is explained inline, so the strategy stays readable long after you built it.
- Entry and exit logic assembled from indicator, signal and time conditions.
- Risk built in — stop loss, take profit, trailing stops, max position size and concurrency limits.
- Edit anything, any time — strategies stay fully editable and version their own history.
Backtesting Engine
Know how it behaved before you fund it.
Run a strategy across long historical windows and get back more than an equity curve: every fill, every hold time, every drawdown, and the distribution of outcomes that produced the headline number.
- Fully customizable runs — capital, date range, symbol universe, costs and execution assumptions.
- Signals on the chart — see exactly where the strategy entered, exited and why.
- Compare and optimize — hold parameters up against each other and keep the version that survives.
Chart Analysis
Charts that show your strategy, not just the price.
A full charting workspace in the style you already know — drawing tools, multiple indicator panes, custom timeframes — with your own strategies drawn straight onto the series, and manual order entry when you want to take the trade yourself.
- Strategy overlays plot live signals and levels on top of the chart.
- Indicator library with configurable parameters and stacked sub-panes.
- Manual trading from the chart, alongside whatever the automation is doing.
Analytics everywhere
Performance you can actually interrogate.
The same analytics layer runs through the portfolio, the analytics page and every backtest. Risk-adjusted ratios, PnL distributions, drawdown profiles and trade-level attribution — so you can tell a good strategy from a lucky one.
- Advanced metrics — risk-adjusted ratios, exposure, hit rate, expectancy and hold-time behaviour.
- Distribution views that bucket trades by outcome instead of hiding them in an average.
- Optimization loops that feed straight back into the strategy that produced them.
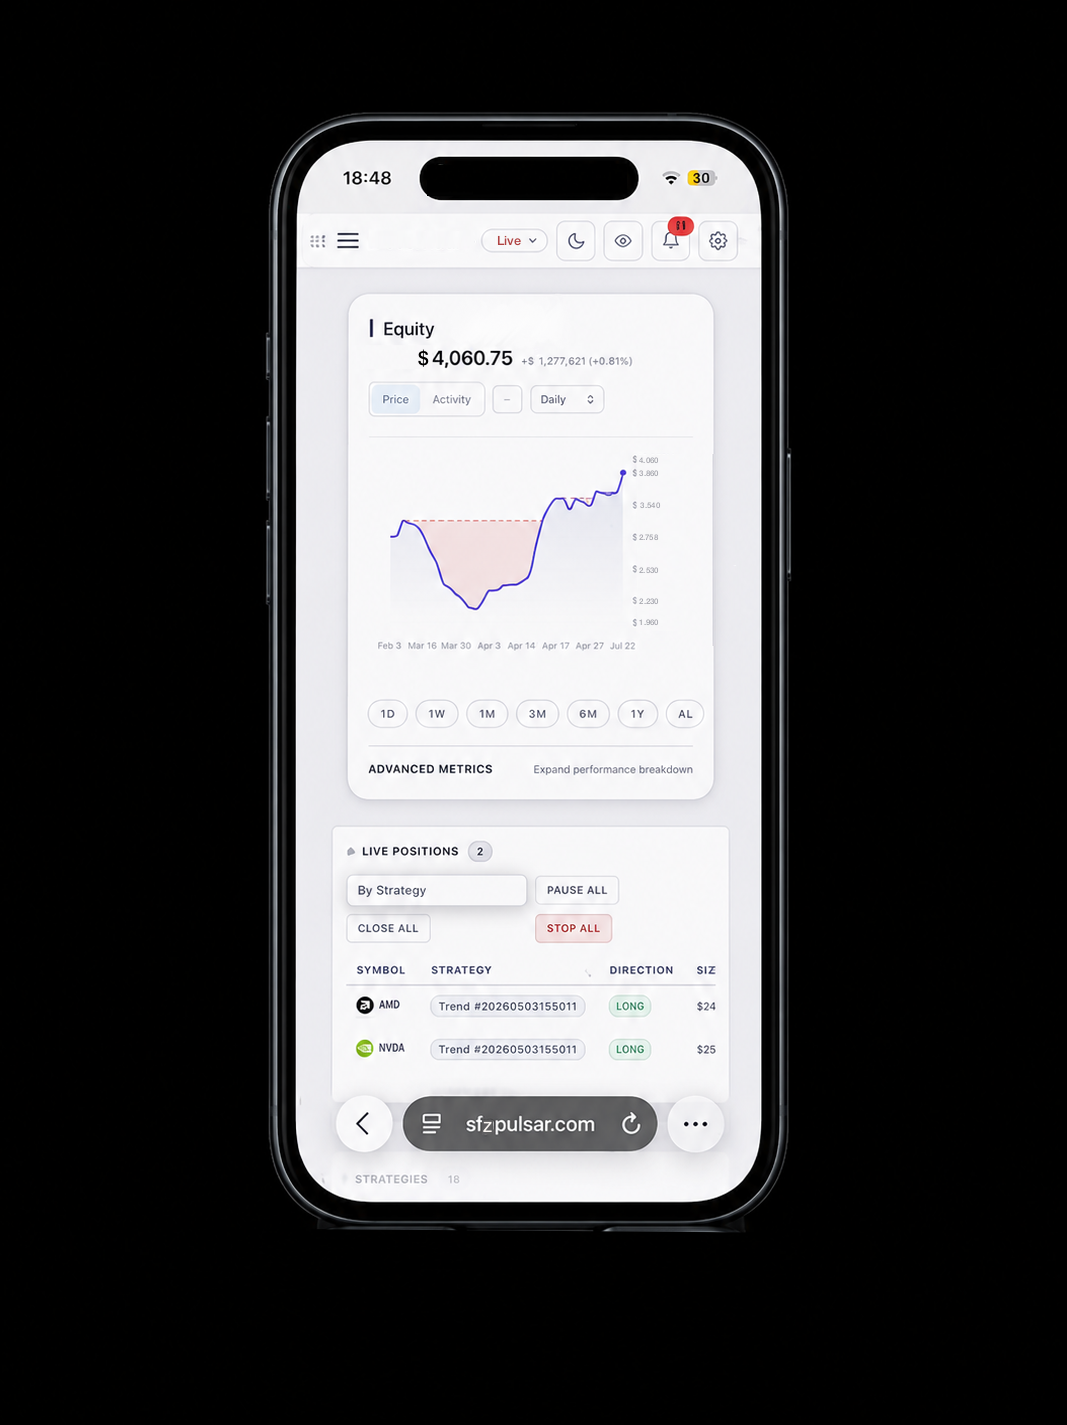
Portfolio & execution
Deploy to paper or live, and keep the controls.
Switch between simulated capital, a clean challenge workspace, broker paper trading and real-money execution. Positions, strategy activity and equity stay on one screen.
How it works
Four steps from idea to live execution.
STEP 01
Create
Build the strategy visually — instruments, indicators, signal logic, risk and sizing.
STEP 02
Backtest
Run it over years of history with your own capital, cost and execution assumptions.
STEP 03
Optimize
Read the analytics, compare variants, and tighten the parameters that actually matter.
STEP 04
Deploy
Push it to paper or live execution and monitor it from the portfolio in real time.
Start building your first strategy.
Pulsar is in closed beta. Create an account, or tell us what you are trying to build and we will get you in.
Trading involves substantial risk of loss. Past and simulated performance are not indicative of future results.